Have you heard this one before? “Just connect to your data in Tableau and start visualizing. Then you’ll publish and share with your whole organization.” It’s a great line, because it’s true. You CAN get started with analysis on top of just about any data in Tableau. But “can” is not “should” — what is possible may not be the BEST way, particularly if you want to scale up. When dealing with massive amounts of data, a better solution is to have two data sources: (1) A pre-aggregated data set for overviews, which I’ll call the Overview data source (2) The row-level data set, which I’ll call the Granular data source. Tableau’s abilities to filter between two data sources (actions & cross-datasource filters in Tableau 10) make this an excellent strategy, and one that I have seen massively improve performance over and over.
Why pre-aggregation is good for your database and good for Tableau
Here’s a quick thought experiment: You need to build an overview dashboard with several filters, that goes down to the weekly level of granularity at best. You are starting with transactional data that records each purchase at the item level with a recording of the full date and time to the second level. How should you build this?
You certainly can connect directly to the transactional tables, and Tableau will ask the database to do all the right aggregations. But think about what you are doing — you are asking the database to go back and re-add all of those individual transactions EVERY SINGLE TIME you show this dashboard. Now, Tableau does a good job of caching, but if people are using filters, or you have any sort of personalization / row level security built in, Tableau will be forced to issue fresh queries for each user.
Unless you are worried about the transactions for the current day, it is unlikely that the data from the previous days will be changing appreciably from one query to the next. If you were to aggregate up to the weekly level (or perhaps even just the DAILY LEVEL), you would be reducing the amount of work that has to be performed each time by the database of simply reading through extraneous lines. Keep in mind that retrieval and working from long-term storage is the physically slowest thing in all of computing. When the results come back more quickly from the data base, Tableau can start rendering the beautiful vizes more quickly. It’s a win for both the database and Tableau.
If this true, why not just pre-calculate everything ahead of time? And isn’t that what OLAP cubes were doing back in the day? I’m sure you’ve heard someone from Tableau tell you cubes are the past and are unnecessary. But the truth is you don’t need to pre-calculate everything, the way that OLAP does; you just need to aggregate enough to lessen the load on your database. And given that your data is big enough, using a Cube as a source for overview dashboards might well be part of your solution.
Determining what to keep when aggregating
Deciding how to aggregate is something you’ll have to put some thought into. What dimensions do you need to keep, what time granularity (or otherwise) do you roll up to, etc. Then you’ll need a mechanism to actually create the aggregated table in the data source. I do highly suggest that it be a real table rather than just a view, with appropriate indexing and all of the other techniques that make for good performance. However, the Overview data source does not need to be in the same data source system as the Granular data source. Many customers use Tableau Data Extracts for their Overview; Extracts have an in-built ability to aggregate that can be simpler to set up than an ETL process in a database.
There are already some great resources (here , here, and here) that explain this mechanism with Tableau Data Extracts, and certainly they are a good way to achieve this. What I want to be clear about is that this same technique works with any data source. Whether you use SQL Server, Redshift, or Impala, you are better off setting up a process that aggregates to a useful level ahead of time, then having that be your main Overview data source in a workbook.
If you are using a live connection and building an Overview connection, remember that for accurate averages, you need to include both SUM() and COUNT(). So each singular measure from the Granular data source may end up as two measures in the Overview data source as a SUM of Measure and Count of Measure.
Make sure also to have your DBA create the appropriate indexes on any field in the Granular table that will be filtered upon. The whole idea is that the Overview table will pass some simple filtering WHERE clauses to the Granular table on fields that are optimized for filtering performance.
Linking the Overview Data Source to the Granular Data Source
To make a workbook that uses the Overview and the Granular pattern, simply connect to the two data sources.

Build all the worksheets that are feasible on the Overview data source. When you have a worksheet that must draw from the Granular data source, go ahead and use it. For performance reasons, you will only want to use that worksheet in a dashboard, where it is filtered from another worksheet based on the Overview data source.
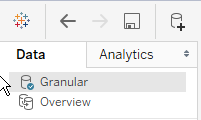
You’ll see here that I’ve built two sheets — the Monthly View uses my Overview data source, while the Daily view uses the Granular data source. I’m going to go up to the Dashboard->Actions menu to link the two together

Now I want to define a filter action
 \
\
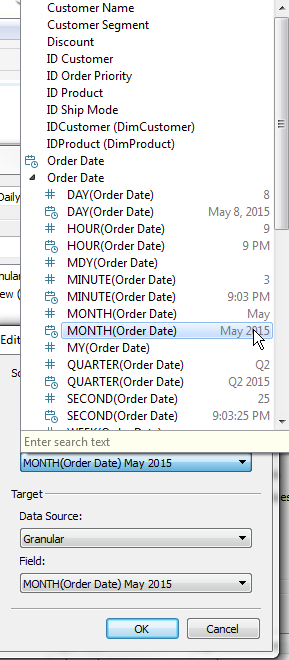
Now I’ll define which fields I want to link across, and set a few options that I know perform the best.The important things are: (1) Exclude all values (2) Selected Fields (3) Choosing the right source (Overview) to go to the right target (Granular)

When you do an action on the worksheet using the same data source, you can use All Fields, but when going to another data source, you must specify which ones you want to use. And honestly, you will always get better performance just by specifying the most limited number of fields that do what you want.
The most difficult linkage is on time fields — I suggest finding the lowest level of Continuous time from the Overview data source, which is my case is Monthly (Continuous show with a more complete date like May 2015 rather than just May). Make sure your Target data source is set to the Granular source, since it will default to the Overview.

Now once you’ve made at least one selection in the Monthly Overview, the Daily View will filter down to the appropriate Sub-Category and Month, but show me the daily values. And when you de-select from the Monthly View, the Daily View will clear completely, thus limiting the amount of data that is ever pulled from the Granular source. You can limit that amount down even further by using the “Run on single select only” option in the Action menu.