Editor’s Note: Huge thanks to special contributor Gordon Rose for this blog post.
Tableau helps people see and understand their data – and guarantees that it in the process, it will never make any changes to that data. Tableau is a strictly read-only technology. However, many customers want the ability to modify the data that lies behind a Tableau visualization (Viz), and then, either see those changes immediately reflected in the Viz and/or make other applications aware of those changes. With a small amount of supporting technology, Tableau’s read-only behavior can easily be integrated into so-called “write-back” use cases.
In this blog article, we’ll explore a way to do exactly that – one in which the write-back components are external to the Viz. An alternative approach is one in which those components are more tightly integrated into the Viz itself – that’s for a later blog article to explore. Ideally you will find that you can use one of these two approaches as a launching point for the development of your own write-back use case.
In this article we’ll walk through a solution based on the first approach. The basic steps will consist of:
- Embedding our Viz in a web page using the Tableau JavaScript API (JS API).
- Providing an area on the web page for capturing the data updates, e.g. an HTML form.
- Defining a means of triggering the write-back use case, e.g. by
- Using a button, clickable image, etc. on the web page to populate the form with data from the Viz (see next step), or,
- Creating a JS API event listener such that we can detect when a user clicks on or selects one or more marks and in response, capture the data associated with the mark(s) and use it to populate the HTML form.
Of course you can do other things with the form, such as optionally toggle it into and out of view as the write-back use case is triggered and then completed, etc.
- Populating the HTML form with data
- If you use an element of the HTML page to trigger the write-back use case, you will be using the new Get Data functionality of the JS API to retrieve data from the Viz.
- If you are using an event listener to trigger the write-back use case, you will be retrieving aggregate level information from the associated mark(s) and, if necessary, using the retrieved values to fetch the lower-level data needed to populate the update form.
- Processing the data updates
- Refreshing the Viz
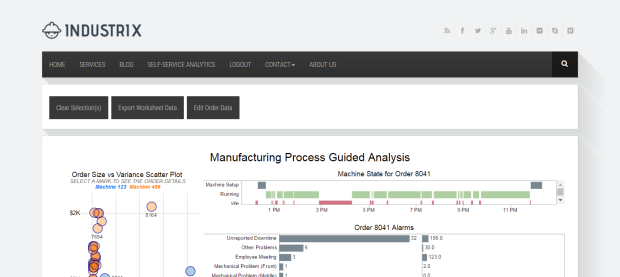
That’s it. Now let’s expand on some of the steps below in more detail. As we do so we’ll “follow along” using a web site developed to demonstrate a fully-featured write-back use case – as well as many other Tableau embedding capabilities. This will help anchor the conversation and give you a better sense of exactly when, where and how the steps of the write-back use case unfold. A screen capture of the site is below. Please note, if you’d like to see the web site in action, simply get in touch with your Tableau representative to arrange a demo.

Our first step was to embed our Viz in a web page.
Embed our Viz in a web page
If the concept of embedding a Tableau Viz is new to you, then I highly recommend reading this detailed discussion before proceeding further with this blog post. A complete code example is also provided in an appendix below. Also, the JavaScript API (JS API) Reference hosted on the Tableau site has a number of examples to help get you started.
The essentials are as follows: you pass the URL of a Tableau Viz on a Tableau Server into the JS API createViz(), which returns a JavaScript object that represents the embedded Viz. This will both load the actual embedded workbook into the page and create a Viz object, which allows you to use JS API in myriad ways to control and interact with the Viz – programmatically drive its behavior, extract data from it, and listen to and respond to events generated by user interaction with the Viz (e.g. the selection of mark(s) by the viewer of the Viz). In our use case we will be focusing on:
- Retrieving data from the Viz in order to populate an HTML form
- Refreshing the Viz after a successful data update
- Optional: Responding to mark selection
Triggering the Use Case
You’ll notice on the screen capture that one of the buttons across the top says “Edit Order Data”. A user triggers the write-back use case simply by clicking that button.
When a user clicks “Edit Order Data” on the page, the form is populated with data and is displayed to the user. Keeping the data update form hidden until needed is easy to do and preserves screen real estate for the Viz when not in use. Please see the screen capture below showing the update form.

There are two primary ways of triggering the write-back use case:
Marks Selection
If you use mark selection, you make it easy for the user to identify the one or more points of data to be edited – you keep things “visual”. If the idea is to support editing the data for more than one mark, this approach becomes even more attractive. In addition, more of the use case is implemented in the Viz (through the use of an event listener tied to the Viz) rather than outside of the Viz (via an HTML element). However, mark selection often triggers an action filter, and giving the same action two meanings would not be a good UI decision.
HTML Button
Using an HTML button (or link, etc.), on the other hand, has the advantage of being a little bit easier to code (no Viz event handler required) and leaves mark selection untouched so that it can still be used as the basis of an action filter or for some other purpose. Using a drop-down list as in the example site above also automatically limits users to editing only one mark’s worth of data at a time. You can’t restrict the number of marks a user can select on a Viz.
Hybrid Approach
It would be fair to say there’s a hybrid approach. That one consists of capturing the selection of marks through an event listener, but not triggering the use case. Triggering the use case is still driven by a clickable HTML element. It’s the approach that requires the most work to implement, but it’s also the most flexible (you can still associate an action filter with the selection of the marks), and it’s very user-friendly (visual selection of the data to be edited). It’s the most work because you have to write an event handler and flesh out the HTML components as well – however, you don’t have to cache the data associated with the marks in your event listener. You just have to retrieve filtered vs. unfiltered data when you use the Get Data API.
Populating the Form with Data Using Get Data
If you haven’t read up on the Get Data API, I recommend this blog post. Once you’ve read through it, you’ll not only understand how to use it, you’ll also have a great use case for it that you will know how to implement.
Meanwhile, in the example web site shown above, we use the getData API to capture the underlying data Viz – the Order ID, “Variance” and “Planned Production” values in this specific example. The Order ID values are used to populate the update form’s drop-down SELECT list and initial values for the INPUT elements, which are then updated when a selection is made from the drop-down list.
It so happens in this case that each mark on the scatterplot corresponds to a single row in the underlying source – very convenient for a write-back use case, in that there is very little data to fetch and present to the user. That won’t always be the case. It will often in fact be necessary to restrict the amount of data retrieved from the Viz for performance reasons and to preserve resources. You can easily do that by using an HTML SELECT element as in the example site, or, by simply counting up the number of marks a user selects and popping up a warning message if the number is too high to be practical for your application.
If the amount of data that has to be retrieved to support your use case is prohibitively large, then it may simply not be a good candidate for integration into a Tableau write-back use case.
A quick note about when you might choose to make your call to getData. If you use the approach used in the example site, you can call the getData API when the user clicks the HTML button. The alternative is to call the API immediately after the Viz has finished rendering. That just involves including the call somewhere in the “onFirstInteractive” function() that you can register to execute as soon as the Viz has loaded and is available for interaction.
A little bit of the code used to fetch the data is shown in an appendix below. There are references to specific measure and dimensions from the Viz used in this test case – you can ignore them, of course.
Update the Source Data
To complete our use case, we need to update the back-end data source to reflect the user’s changes and then refresh the Viz to see them.
We have two choices for transmitting the data updates to our application server for processing – submit a traditional HTML form, where the browser makes a round trip as it navigates to the URL specified by the form’s ACTION value then returns, or, make an AJAX call. AJAX, or Asynchronous JavaScript and XML, is a well-established standard for making asynchronous calls to server-side code directly from the comfort of the JavaScript on your web page, avoiding a server round server trip. That increases the fit and finish of your application, as well as its performance.
This example uses AJAX for the reasons listed above – it turns the remainder of implementing our use case into a quick, one-two punch – apply the changes to the underlying data source and refresh the Viz, entirely in JavaScript, and without a page refresh (after all, flow is important when creating and when interacting with a Viz, and a page refresh interrupts flow). Of course, the server-side logic associated with making the data updates will be very specific to each individual use case.
Refresh the Viz!
Assuming data updates are transmitted to the server using AJAX, and the operation is successful, then the only remaining step is to refresh the Viz. That’s a simple, one-line call. We’re finished!
Appendix A
The basics of embedding a Tableau Viz in a web page involves no more than creating an HTML DIV on your web page where you would like the Viz to be rendered, assigning an ID to the DIV (for our purposes, let’s say “vizDiv”), and then using a handful of lines JavaScript to load and initialize the Viz. Below just four lines of JavaScript do the trick (you must also reference the Tableau JS API library itself before making the JavaScript calls, of course):
  var vizURL = "http://localhost/views/JSAPIExamples/LineChart";
  var vizDiv = document.getElementById('vizDiv');
  var options = {
    height: '900px',
    width: '1000px',
    hideTabs: true,
    hideToolbar: true //
    // -- we can define additional JavaScript to be executed
    //    after the Viz has completed loading
    onFirstInteractive: function() {
      console.log(“Viz has completed initial load.”);
    }
  }
  // -- can really be done in one line
  viz = new tableauSoftware.Viz(vizDiv, vizURL, options);
The HTML then would only need to include a DIV with an id of ‘vizDiv’ located where you wanted to Viz to be rendered. Also, a small tip - use a standard DOM approach to instantiating the DIV object, as shown above, rather than jQuery, even if you are using jQuery for other purposes. The latter can lead to unexpected placement of the Viz on your HTML page.
Appendix B
And finally, here is some sample code using the Get Data API.
// -- get current sheet
var targetSheet = viz.getWorkbook().getActiveSheet();
dataOptions = {
  maxRows: 0, // -- 0 means all rows
  ignoreAliases: false,
  ignoreSelection: true
};
var sheetData = targetSheet.getSummaryDataAsync(dataOptions).then(
  function (table)
    {
      populateSelect(table);
    }
);
Here’s a small tip. Notice the use of .then() in conjunction with the getSummaryDataAsync(dataOptions) method. When a JS API method is asynchronous, you can invoke its .then() method to handle the results of the call when it completes. In this case, the function to populate the HTML Select element is called with the data returned from the getSummaryDataAsync(dataOptions) method.
We don’t want to get too deep into the nitty-gritty of working with the Get Data API, but here is a stripped down example that shows the basics of working with the object returned by the API. In the example we retrieve the Order IDs (additional code not shown would retrieve other data items associated with each order and populate the SELECT and INPUT elements, etc.)
This code uses jQuery to simply access to the relevant HTML elements. It also references specific columns in the worksheet’s underlying data as well as specific HTML elements present on the sample use case’s live page. The names of your data columns, the IDs of your HTML elements, etc. will of course be unique to your use case.
function populateSelect(table) {
  // -- Get Data returns a two-dimensional array of data only
  // The first array index is the row index and the second array index
  // is the  column index.
  //    Column metadata is available via getColumns()
  var data = table.getData();
  var cols = table.getColumns();
  // -- in this example we're looking for three specific columns and
  //    want to know where they are in the data object
  var orderColIdx = -1; var varColIdx = -1; var plannedColIdx = -1;
  for (c = 0; c < cols.length; c++) {
    if (cols[c].getFieldName() == "Order #")
      orderColIdx = c;
    if (cols[c].getFieldName() == "SUM(Variance $)")
      varColIdx = c;
    if (cols[c].getFieldName() == "SUM(Production Planned)")
      plannedColIdx = c;
    if (varColIdx >= 0 && orderColIdx >= 0 && plannedColIdx >= 0)
      break;
  }
  // -- gather the data values in arrays
  var variances = [];
  var planned = [];
  // -- var to hold HTML of SELECT we are building
  var selectOrderHTML = "";
  // -- Clear SPAN that will contain SELECT
  $("#selectOrderIdSpan").html("");
// -- Did we find the data columns we were looking for?
  if (varColIdx == -1 || orderColIdx == -1 || plannedColIdx == -1) {
    // -- close editing form, handle error
    return;
  }
  // -- OK to Proceed - clear SELECT
  $('#selectOrderId').empty();
  // -- Loop through rows of data, progressively building SELECT HTML
  for (r = 0; r < data.length; r++) {
    var colValues = data[r];
    var orderId = colValues[orderColIdx].value;
    var varianceVal = colValues[varColIdx].value;
    var plannedVal = colValues[plannedColIdx].value;
    variances.push(colValues[varColIdx]);
    planned.push(colValues[plannedColIdx]);
    $('').val(varianceVal + '/' + plannedVal).text(
     'Order # ' + orderId).appendTo('#selectOrderId');
  }
  // -- sort HTML select
  $("#selectOrderId").html($("#selectOrderId option").sort(
    function (a, b) {
      return a.text == b.text ? 0 : a.text < b.text ? -1 : 1
  }));
  // -- initialize form, etc. - we're done with Get Data for now
