Currency conversion comes up relatively frequently in conversations about Tableau, but there’s not a ton written about it specifically for Tableau, because the solution is actually a generic solution for currency conversion with relational databases.
The main thing to remember with exchange rates is that they change over time, and therefore need to be stored with a Date field. Any join to the fact data you have must JOIN on the originating currency and the date of the transaction. Some organizations may have specific rules on the exchange rates they use over a specific date range — I’ll be showing a daily example, but obviously if you calculate your exchange rates monthly for reporting purposes, the same concepts will work.
The essence of the solution is to JOIN in an exchange rates table to your data. Let’s say I am an North American company which exports a range of products for the European market that are less frequently purchased by North Americans.
We’ve always been a bit Anglo-centric, so our sales to Great Britain are equivalent to those in the rest of the European Union. We’ve lucked out and actually are selling the exact same quantity day to day and in both currency zones.
| Date | Product | Price | Quantity | Sales Currency |
| 6/21/2016 | Tweed Jackets | 100 | 5 | EUR |
| 6/21/2016 | Tweed Jackets | 100 | 5 | GBP |
| 6/22/2016 | Miniature Cars | 15000 | 20 | EUR |
| 6/22/2016 | Tiny Horses | 15000 | 2 | EUR |
| 6/22/2016 | Miniature Cars | 15000 | 20 | GBP |
| 6/22/2016 | Tiny Horses | 15000 | 2 | GBP |
| 6/23/2016 | Upper Lip Stiffener | 20 | 1000 | EUR |
| 6/23/2016 | Upper Lip Stiffener | 20 | 1000 | GBP |
| 6/24/2016 | Tweed Jackets | 100 | 5 | EUR |
| 6/24/2016 | Miniature Cars | 15000 | 20 | EUR |
| 6/24/2016 | Tweed Jackets | 100 | 5 | GBP |
| 6/24/2016 | Miniature Cars | 15000 | 20 | GBP |
| 6/27/2016 | Tiny Horses | 15000 | 2 | EUR |
| 6/27/2016 | Upper Lip Stiffener | 20 | 1000 | EUR |
| 6/27/2016 | Tweed Jackets | 100 | 5 | EUR |
| 6/27/2016 | Miniature Cars | 15000 | 20 | EUR |
| 6/27/2016 | Miniature Cars | 15000 | 20 | GBP |
| 6/27/2016 | Tiny Horses | 15000 | 2 | GBP |
| 6/27/2016 | Upper Lip Stiffener | 20 | 1000 | GBP |
| 6/27/2016 | Tweed Jackets | 100 | 5 | GBP |
| 6/28/2016 | Upper Lip Stiffener | 20 | 1000 | EUR |
| 6/28/2016 | Upper Lip Stiffener | 20 | 1000 | GBP |
I have to report my earnings in USD to submit them to Wall Street, so internally we do all our comparisons in USD, regardless of the originating currency. To do this, I need a currency conversion table. I brought down the conversion rates for EUR and GBP from xe.com (here’s an example); ideally you’d be keeping the exchange rates in a table in your database and have a process for keeping them up to date.
| Date | Original Currency | USD | EUR | GBP | INR | AUD | CAD |
| 6/21/2016 | GBP | 1.47 | 1.30 | 1.00 | 99.35 | 1.97 | 1.88 |
| 6/22/2016 | GBP | 1.47 | 1.30 | 1.00 | 99.08 | 1.96 | 1.88 |
| 6/23/2016 | GBP | 1.48 | 1.30 | 1.00 | 99.58 | 1.95 | 1.89 |
| 6/24/2016 | GBP | 1.36 | 1.23 | 1.00 | 92.52 | 1.83 | 1.76 |
| 6/27/2016 | GBP | 1.32 | 1.20 | 1.00 | 89.81 | 1.80 | 1.73 |
| 6/28/2016 | GBP | 1.33 | 1.20 | 1.00 | 90.21 | 1.81 | 1.74 |
| 6/21/2016 | EUR | 1.13 | 1.00 | 0.77 | 76.27 | 1.51 | 1.44 |
| 6/22/2016 | EUR | 1.13 | 1.00 | 0.77 | 76.18 | 1.51 | 1.45 |
| 6/23/2016 | EUR | 1.14 | 1.00 | 0.77 | 76.51 | 1.50 | 1.45 |
| 6/24/2016 | EUR | 1.11 | 1.00 | 0.82 | 75.45 | 1.49 | 1.44 |
| 6/27/2016 | EUR | 1.10 | 1.00 | 0.83 | 74.86 | 1.50 | 1.44 |
| 6/28/2016 | EUR | 1.11 | 1.00 | 0.83 | 75.00 | 1.50 | 1.45 |
If you look at rates for the British Pound (GBP), you’ll understand why it is important to look at these rates with a time aspect in place.
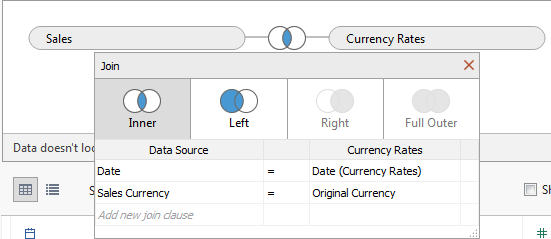
Let’s put everything together in Tableau. First, JOIN the main data table to the currency conversion table, with both Date and the original Currency field linking the two tables.
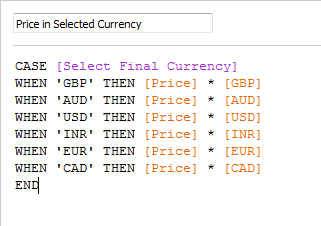
Next, you’ll need to create a Parameter which has all of the currencies that can be converted into. Its values should match the currency symbols (EUR, GBP, etc), although you are welcome to give the long names for the display aliases. You’ll use the parameter to determine which rate will multiply against the currency totals. In this example, the calculation adjust the base price of each item. Mathematically, there’s no reason you couldn’t do this against the overall sales, or on aggregates instead of the row level. If you are using extracts, none of this can be pre-calculated anyway because of the parameter’s flexibility, so it’s doubtful that there are performance differences between the different calculations you might write.
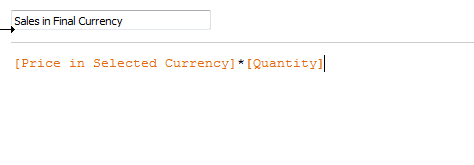
Now the price needs to multiply against the quantity for the adjusted sales. Any values that need to be adjusted will require a Calculated Field that does an adjustment like this.
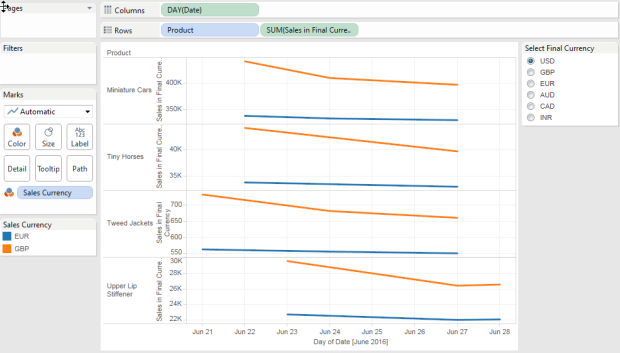
Now we can see why currency conversion is necessary to know how much we’re really making (remember, the quantities and prices in the original currency themselves were identical between currency zones and from day-to-day). Looks like quite a bit of our sales in dollars made some kind of exit on the 24th…

Great Article
thanks for sharing helpful information
LikeLike