Tableau does small multiples really well, but if you really only have one dimension, the only way to display things is in a straight list. With a couple of simple calculations, you can transform that list into a trellis, making 2 dimensions out of one!
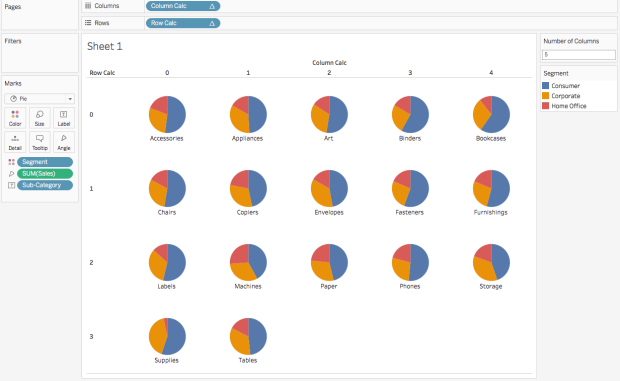
If you look at the screenshot, you’ll notice that the Columns and Rows are both calculations, Table Calculations to be precise. These are generic calculations that can be added to any workbook.
[Number of Columns] is an Integer type Parameter, necessary for the modulo and division calculations..
Column Calc
( INDEX() - 1 ) % [Number of Columns]
Row Calc
INT ( ( INDEX() - 1) / [Number of Columns] )
How do these calculations work? The Column Calc is using the Modulo operator (%), which only returns the remainder from division. The remainder will be the same for each multiple in a list — i.e. 3, 5, 7 all have 1 as a remainder when divided by 2. This allows for grouping in the columns.
The Row Calc is basically cutting the Index into as many slices as there are columns.
You set both of these calculations to be Discrete (blue pills) and they will create individual “slots” in a trellis.
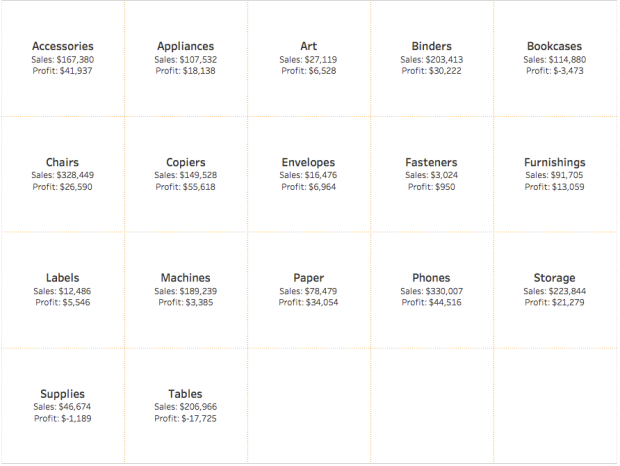
In the screenshot, the “listing” element is Sub-Category. So the Compute Using option of both calculations should be set to Sub-Category. This makes the INDEX() function calculate down the Sub-Category field. This field must be on the Marks card somewhere — at minimum in the Detail. You can add in additional fields to make more interesting displays, like the pies. It’s also a great way to display multiple text elements without them being straight lists.
Deselect “Show Headers” and the trellis layout calcs disappear to the end user.