Tool to Convert ArcGIS Shapefiles into Tableau Polygons

The Information Lab‘s Craig Bloodworth uploaded a fantastic tool to the free Alteryx Analytic Gallery that will convert any ZIP file containing ArcGIS SHP file information into Tableau polygons, and export that in either CSV or TDE.

All you need to do is sign up with Alteryx for free and then have a ZIP file to upload. For those new to all this, SHP or Shapefiles actually are composed of several files, so they are distributed in ZIP format to hold them all together.

https://gallery.alteryx.com/#!app/Tableau-Shapefile-to-Polygon-Converter/5296f89120aaf905b8e7fb48

These are the same techniques used by the folks over at http://tableaumapping.bi/ to build their shape sets, so you might find a useful one already converted over there.

URL Filters Work on both Original Field Name or Renamed Name

From embedded views to using tabcmd for unique exports, Tableau’s ability to filter using URL parameters is a fantastic way to programmatically drive customized vizes. Most of the use cases are covered in the KB article:

http://kb.tableau.com/articles/knowledgebase/view-filters-url

One thing that isn’t mentioned is that you can filter on both the original field name as Tableau brought it in from the original data source, or using the name you renamed it to. For example, I have renamed my “Region” field in the Super Store dataset from ‘Region’ to ‘Region - Renamed’. Both of these work when using URL filters:

…Sheet1?Region=East

and

…Sheet1?Region%20-%20Renamed=East

result in the same filtering. Just remember in both cases to delete the portion after the ‘:’ in 9 or the ‘#’ in the 8 series.

Creating Custom Polygons By Drawing Directly on a Google Map

There are times when you need a custom shapes because states or cities just aren’t cutting it, but you don’t have any definitions of the shapes. All you need are the longitude and latitude but how do you get them? I’ve built a tool that lets you draw directly onto a Google map and then generates the correct CSV output to be used as custom polygons in Tableau.

You can find the HTML file here on GitHub, simply download and save to a directory on your computer:

https://github.com/bryantbhowell/tableau-map-pack/blob/master/draw_tableau_polygons_on_google_maps.html

How does it work? When the Google map loads up, find the place you want to draw on and simply click on the point you want to start. A line will appear to draw the next place.

polygon on map

When you touch the line back to the starting point, a box will pop up and ask your what you want to name the polygon. This should be an identifier that matches up with the data you want to blend in later.

naming a polygon

Once you’ve created all the polygons you want, there is an “Open CSV Results” button

open results

which will pop open a dialog box with the CSV output. Copy this CSV into a text file and save, or paste it directly into Tableau. Now you have the data for your polygons.

csv to copy

You set these up in the exact same way as the CSV output from tool to draw on the background images, only you don’t need to do the background image part, you just use the Latitude and Longitude included in the CSV data. You can see those instructions at the end of this blog post

Implementing the Tableau 9.0 REST API — Part 3 — XML Parsing

XML

The “eXtensible Markup Language” is the basis for all messages in the Tableau REST API. Both your requests to and your responses from the Tableau Server will be made in UTF-8 encoded XML. In general, the Tableau REST API schema keeps all information in XML attributes, so there is no need to constantly determine if the info is in an attribute or in the text between the tags. However, there are two parts of the XML standard that are worth understanding and making sure you have facilities for.

XPath

XPath is the query language for the Document Object Model used in XML (and HTML). You bought Tableau so you wouldn’t have to write queries anymore, right! XML documents are not relational tables, but tree-models, and XPath was specifically designed to query this type of data structure effectively, making it very useful for finding exactly what you want in an XML document, regardless of where it is located or how many results there are. On the other hand, XPath bears zero resemblance to SQL, so you’ll have to learn to read and think in document trees with a whole new syntax.

XPath may not look familiar but it lets you answer some very interesting questions.

For example, when you query Workbook Permissions, there are a number of tags that have nested tags inside.

<granteeCapabilities>
<group id="group-id" />
<capabilities>
<capability name="capability" mode="capability-mode" />
</capabilities>
</granteeCapabilities>

The following XPath query will bring back matches all of the capabilities with a given name attribute that fall under the tag that has tag with the given group_luid

//t:granteeCapabilities[t:group[@id=’$group_luid’]]/t:capabilities/t:capability[@name=’$capability_name’]

We will see more examples of XPath as we work through more of the library. You’ll also notice the “t:” prefix used in the XPath query. This is a short alias for the Tableau REST API XML Namespace, and it is essential.

Namespaces

XML has a concept called Namespaces, and the Tableau REST API definitely has a declared namespace. In the PHP library, we register ‘t’ as an alias for the Tableau namespace so that later we can use the short letter before returning any XML response. You have to prefix every element you search for in an XPath query with the namespace or its alias, or it will not parse correctly and will return nothing.

public function getResponse(){
if($this->response_type == 'xml' && $this->simple_xml_object !== null){
// Register a namespace alias for xpath queries
$this->simple_xml_object->registerXPathNamespace('t', 'http://tableausoftware.com/api');
return $this->simple_xml_object;
}
else {
return $this->raw_response;
}
}

http://www.w3schools.com/xml/xml_namespaces.asp

XML Parsing Library

You’ll need to decide on a code library for parsing and working with XML. None of the XML structures are complex, but you’ll want something with facilities for handling namespaces, XPath, and easy iteration.

In the two example libraries,I’ve chosen SimpleXML( http://php.net/manual/en/book.simplexml.php ) in PHP and lxml ( http://lxml.de/ ) in Python. Both provide easy iteration using their language’s native facilities and also full XPath querying. ElementTree in Python does not have a complete set of XPath abilities, or as easy of a syntax for dealing with namespaces. You will see them both used as we dive into the libraries..

Implementing the Tableau 9.0 REST API — Part 2 — Tokens, Sign-In and LUIDs

Tokens

One distinct feature of the Tableau 9.0 REST API is that you must be logged in to a site on the Tableau Server to perform any action other than sign-in or sign-out. When you sign-in successfully to a site, you receive a token, which then must be passed as a header in the format

X-tableau-auth: token

in every subsequent HTTP request. So our first step needs to be signing in and grabbing the token for reuse.

Sign-in

What do you need to sign-in? At a basic level:

  • server location
  • username
  • password
  • site name: This is the “ContentUrl” i.e. the name as it appears in the browser URL

http://onlinehelp.tableau.com/current/api/rest_api/en-us/help.htm#REST/rest_api_ref.htm#Sign_In%3FTocPath%3DAPI%2520Reference|_____51

This is the XML request we need to make to log in:

<tsRequest>
<credentials name="username" password="password" >
<site contentUrl="site-name" />
</credentials>
</tsRequest>

And then we will send this as an HTTP POST (remember Part 1?) to the following URI:

https://$servername/api/2.0/auth/signin

If successful, we’ll receive back an XML response with two essential pieces of information

  • login token
  • site id / site luid
<pre>
<?xml version="1.0" encoding="UTF-8"?>
<tsResponse version-and-namespace-settings>
<credentials token="12ab34cd56ef78ab90cd12ef34ab56cd">
<site id="9a8b7c6d-5e4f-3a2b-1c0d-9e8f7a6b5c4d"
contentUrl="MarketingSite"/>
</credentials>
</tsResponse>
</pre>

You can see both of these items in the XML response. To do anything useful with them, we’re going to have to parse the XML to pull out the info we need. Before we touch on that, let’s talk about the format of the ‘id’ attribute and what an LUID is.

LUIDS

The ‘id’ attribute of the <site> tag is not the text of the site name (that is referred to as the ContentUrl). It isn’t really human readable at all. Most referencing in the Tableau REST API is done via these “locally unique identifiers” (LUIDs), which are 32-character hexadecimal strings that always identify a given resource. This is useful because many things can be changed about an object in Tableau Server — you can change a group’s name, or the full name of a user, etc. Most of the code library is devoted to finding and translating names into LUIDs so they can be referenced in the API calls.

Anywhere you see the “id” property in the REST API XML or a URI description, it is an LUID and not a name, even if the name never changes. From the sign-on process then, we want to grab the LUID of the site rather than the ContentUrl, because we will reuse it with every subsequent call, because the format for every call that affects something on a site must begin with the site luid, like:

https://$servername/api/2.0/sites/$side_luid/

http://onlinehelp.tableau.com/current/api/rest_api/en-us/REST/rest_api_concepts_luid.htm

Implementing the Tableau 9.0 REST API — Part 1 — HTTP Requests

Tableau Server 9.0 introduces a much expanded REST API for server management. The REST API has existed since 8.2 but in 9.0 it now covers the vast majority of administrative actions you might want to do. Along with all the improvements, there is also fantastic documentation on every possible method in the Tableau Server Administration Guide.

http://onlinehelp.tableau.com/current/api/rest_api/en-us/help.htm#REST/rest_api.htm

In this series, I’m going to walk you through some of the concepts and what an actual implementation of a couple of libraries for interacting via the REST API. By working through these sample implementation libraries and scripts, you will see the general method for working with the REST API and the specific order of steps needed to accomplish some common requests. I’ll be presenting examples from a library written in both PHP and Python, to illustrate use cases for embedded portals and administration.

https://github.com/bryantbhowell/tableau_rest_api/blob/master/rest_api.php

REST-ing Easy

Unlike the JavaScript API or the Data Extract API, which explicitly define the actual code in the languages they exist for, the REST API is simply a documented set of URIs, HTTP methods, and XML requests that can be implemented in any language that can handle XML and HTTP requests. In the end, you’ll implement in the language you develop for and prefer. While this provides flexibility, it also means that you need to do some coding to actually implement the functionality.

HTTP isn’t just the start of a url

REST APIs use a wider range of the HTTP standard than most end users have ever explored. Traditionally, databases are said to have the CRUD capabilities: Create, Read, Update, Delete. Tableau’s REST API, like many REST APIs, uses four HTTP verbs to represent these abilities: POST, GET, PUT, DELETE.

GET is the most familiar: it is the verb used when you access a URL in a web browser. If you’ve ever built forms in HTML, you may also have encountered POST, which allows you to send data back to the server. In the Tableau REST API, PUT send data like a POST, but causes an update to an existing resource. DELETE’s use is pretty obvious.

If we look at the REST API documentation, the name of the actions translate pretty closely to the HTTP verb we are going to use. Query… or Get… tend to be HTTP GET. Add… is accomplished via POST, while Update… uses PUT. Remove… or Delete… use DELETE. So to make all this work, we’ll need to implement a reasonable way to make the correct HTTP request when we want to perform an action.

How do we actually do all these exotic HTTP requests? Every language and platform has libraries for accomplishing them. At the basic level, the cURL library ( http://curl.haxx.se/ ) allows for the full range of HTTP requests to be expressed. In the example PHP library, I’ve used PHP cURL since it is available in almost all standard packages, but encapsulated all of the necessary rules into a single method. In Python, a slight modification to the standard urllib2 will handle most our needs.

Here is the main method that handles the HTTP request via cURL:

    protected function _make_request($page_number = 1){
        $url = $this->base_url;
		$url .= "?pageNumber=$page_number";
        $this->last_url_request = $url;
        $req = curl_init($url);
		if($req === false){
			throw new Exception("Error with setting URL in cURL library");
		}
       // Set to a GET if no data to POST
       if($this->http_verb == 'delete'){
           curl_setopt($req, CURLOPT_POST,0);
           curl_setopt($req, CURLOPT_CUSTOMREQUEST,"DELETE");
       }
       // Get when no XML_request
       elseif($this->xml_request == null){
            curl_setopt($req, CURLOPT_HTTPGET,true);
       }
       elseif ($this->http_verb == 'post'){
            curl_setopt($req, CURLOPT_POST,1);
            curl_setopt($req, CURLOPT_POSTFIELDS, utf8_encode($this->xml_request) );
       }
       elseif ($this->http_verb == 'put'){
           curl_setopt($req, CURLOPT_POST,0);
           curl_setopt($req, CURLOPT_CUSTOMREQUEST,"PUT");
           curl_setopt($req, CURLOPT_POSTFIELDS, utf8_encode($this->xml_request) );
       }
       // All calls other than signin or signout have to pass the header with the token
       if($this->token != false){
            curl_setopt($req, CURLOPT_HTTPHEADER, array("X-tableau-auth: {$this->token}") );
       }
       if($this->response_type == 'png'){
           curl_setopt($req, CURLOPT_BINARYTRANSFER,1);
       }
		curl_setopt($req, CURLOPT_RETURNTRANSFER, true);
		curl_setopt($req, CURLOPT_CONNECTTIMEOUT,60); // Increase connect time limit
		curl_setopt($req, CURLOPT_TIMEOUT,60); // Increase response time limit
		$response = curl_exec($req);
		if($response === false){
			$error = curl_error($req);
			throw new Exception("cURL HTTP request failed: $error");
		}
		$curlinfo = curl_getinfo($req);
		$this->last_response_headers = $curlinfo;
		$this->raw_response = $response;
		// Check for HTTP Response codes
		$http_response = $curlinfo['http_code'];
		if ($http_response >= (int) 400){
		   $this->last_error = $this->raw_response;
		   throw new Exception("HTTP Response code $http_response is an error code. Retrieve full error for more details");
		}
    }

You’ll notice I’m calling some internal methods to help with generating the request; we’ll dive further into the structure of the library in another part of the series, but I trust it is mostly self-explanatory. Two important things:

  1. Every request other than sign-in or sign-out must have a Tableau specific HTTP header that includes your sign-in token: X-tableau-auth: {$this->token}
  2. All XML must be posted UTF-8 encoded

Once we know we are able to express ourselves using all of the the necessary HTTP verbs, we can start talking to the Tableau Server. The first thing it will want to know is who we are and if we should be there, which I’ll cover in Part 2.

Creating Custom Polygons on a Background Image

You may have seen some of the awesome examples combining Tableau’s background images with custom polygons to generate stadium maps, baseball strike zones, and so forth. While these are relatively easy to do in Tableau, there is a certain process involved, and getting the exact coordinates on the image can be challenging.

I’m going to use common request, a planogram for shelf space, to show you a tool for easily drawing out your polygons, and how then to get it all set up in your Tableau viz.

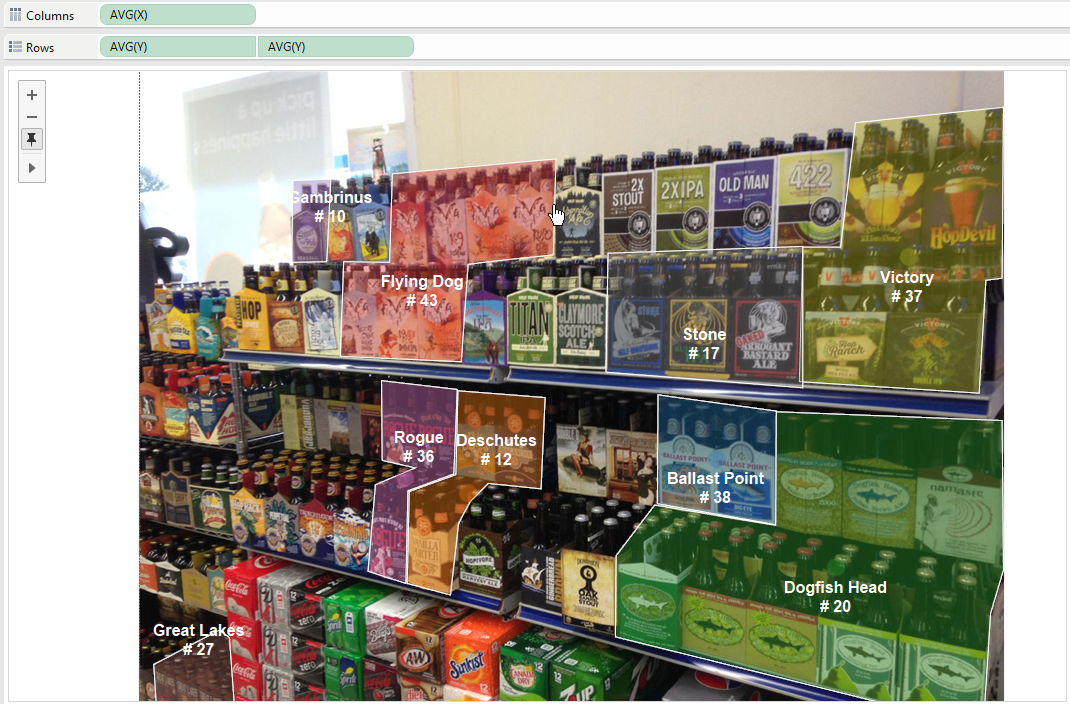
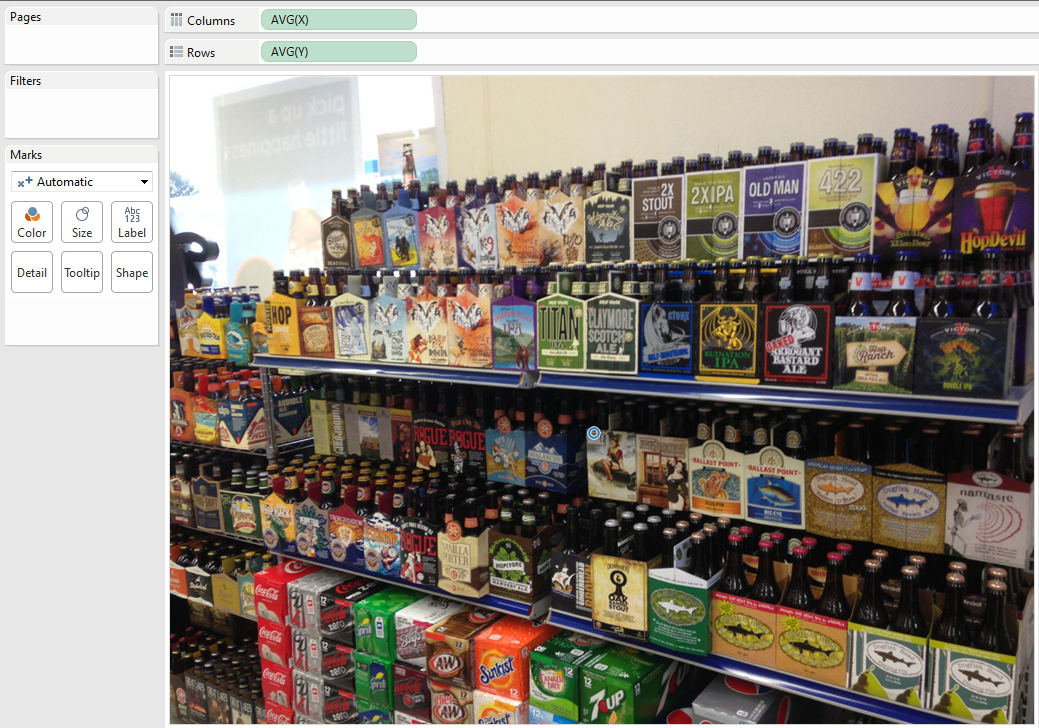
We’re going to end up with this:

tableau planogram example using background image and custom polygons

tableau planogram example using background image and custom polygons

(image taken from http://brewprof.com/craft-beer-spot-jeffs-marathon/ who I hope won’t have any objections)

There are three pieces to any background image map in Tableau.

  1. Data, with an identifier column to match up with the polygons you draw
  2. An image
  3. A polygon mapping data source

Let’s talk about how Tableau represents polygons. Every row will represent a vertex (corner) of a polygon. To know which vertex belongs to which polygon, there needs to be an identifier on each row. Then there should be an X coordinate and a Y coordinate column. Finally, each polygon vertex needs an Order, so that Tableau knows how to draw the lines.

This can be in any data source, but since we’re generating them manually using our tool, Excel or CSV will work just fine. The data will look something like this:

Identifier,Path_ID,X,Y
Victory,1,977,499
Victory,2,1243,482
Victory,3,1253,649
Victory,4,1277,652
Victory,5,1279,905
Victory,6,1060,882
Victory,7,1038,698
Victory,8,982,698
Stone,1,982,699
Stone,2,694,689
Stone,3,691,689
Stone,4,691,513

We want our Identifier to match up with something in our data. For this example, I grabbed the Top 50 US Breweries in 2013 from https://www.brewersassociation.org/attachments/0001/4525/CBP13_Top_50.pdf . I copied down the names and ranks into a spreadsheet, attached here: Top Breweries

I’m going to use the Short Company Name to name my polygons as I create them.

The next steps involve my “Draw Tableau Polygons on Custom Background Image” tool, available here:

https://github.com/bryantbhowell/tableau-map-pack/blob/master/draw_tableau_polygons_on_background_image.html

Just download the HTML file into a directory on your computer. Place the image you want to draw on in the same folder as the HTML file (this is essential). Now open up the HTML file in Chrome, Firefox or Safari (I haven’t tested with IE, but it might work in 8 or later).

You should see a page with a big list of instructions. Read them! They explain the basic functionality of the tool. For your reading pleasure, here are the rules:

  1. Choose an image file using the Choose File button. The image must be in the same folder as this HTML file on your computer
  2. Click in the image to create the points in your polygon. The tool will draw a line between each point
  3. DO NOT DRAW A POINT TO COMPLETE YOUR SHAPE! Either Right-Click or press the “Complete Polygon and Name” button at the bottom
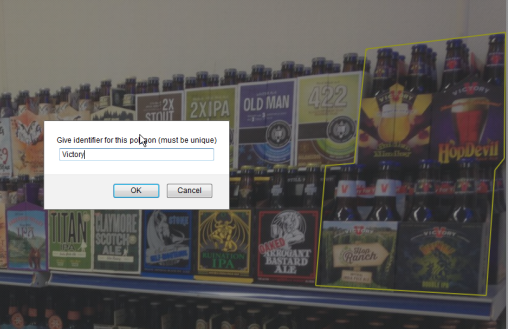
  4. When you Complete a Polygon, give it a name. This should match up with a field from the other data you want to blend onto the polygons
  5. Draw all the polygons you want, following steps 2-4 above.
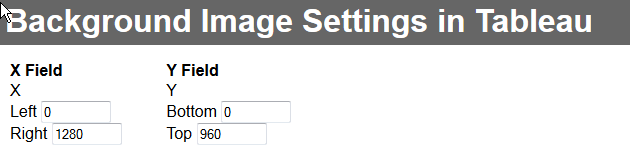
  6. Once you’ve drawn all the polygons, press the “Output Polygons” button. You’ll then see the correct Background Image settings for Tableau and a list of points in CSV format
  7. Copy the list of points (including the headers) over into a text file and save it as a .csv
  8. You can go back and add more after your initial output. Just press “Output Polygons” again and the output at the end will update.
  9. Use the “Background Image Settings in Tableau” area as correct values when you go to Maps->Background Images->Add Image in Tableau Desktop

The biggest thing to remember is that you DO NOT HAVE TO DRAW the last point, just RIGHT-CLICK or press “Complete Polygon and Name”. You can also reverse back any misstep up until you have completed the Polygon.

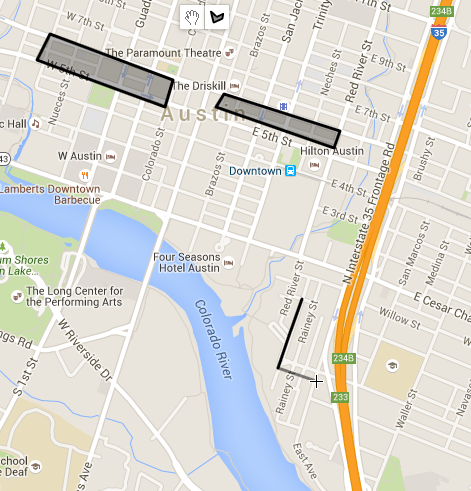
Change your color to something you can see against your image, then start clicking to draw.

starting to draw
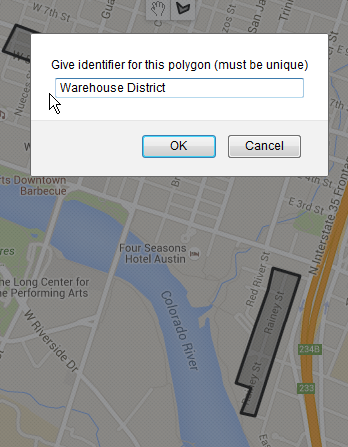
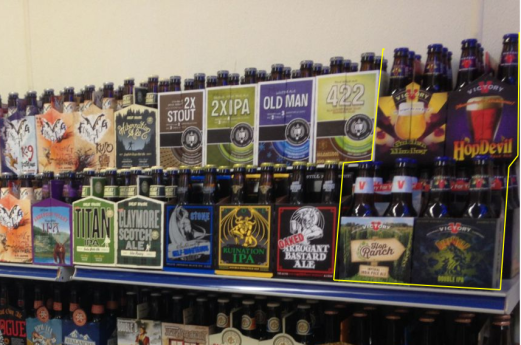
Now right click to finish, and give it a name. You’ll see the line drawn to complete it, but this is just a visual aid and not actually written into the data. Tableau completes the polygons automatically as well.

saving the polygon
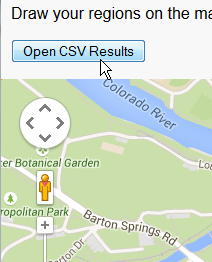
Draw as many polygons as you need, and when you are done, click the “Output Polygons” button at the bottom of the page.

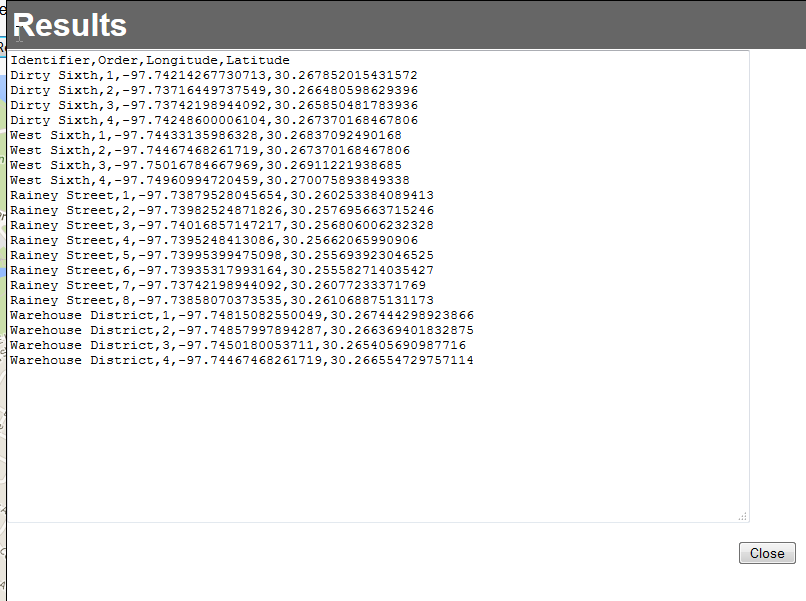
You’ll see a pop-up box with some instructions, the settings for the Background Image you’ll need in Tableau, and a text box with the CSV output of the polygons.

Copy the CSV from the text box and either save as a text .CSV or paste the data into Excel. If you paste into Excel, use the Text-to-Columns function to split by Comma. You can also use directly as a CSV, because we’re going to be using Data Blending.

Now we’ve got the essential components to make our planogram. Fire up Tableau Desktop, and connect to your initial data. Then make a second data source to the polygon data. Start a sheet using the Polygon data source.

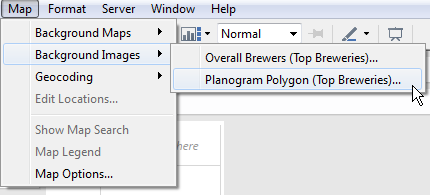
The first thing we need to do is set up the background image. This is is set in the Map->Background Images menu (choose the Polygon data source as it will be our primary data source)background image menu

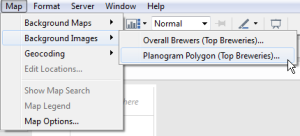
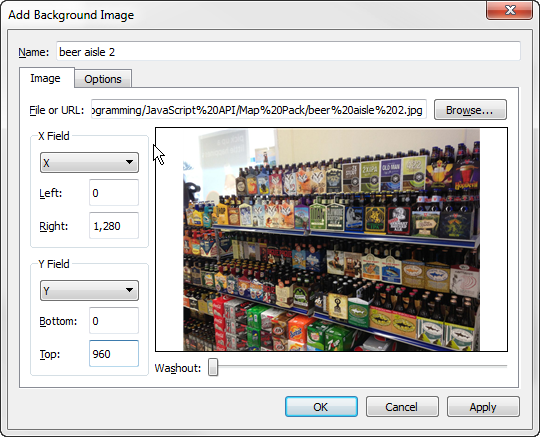
Now in the following menu, choose “Add Image”. Press “Browse” to find the background image file. This is where the middle section of the output from the tool becomes important.

This:settings from tool
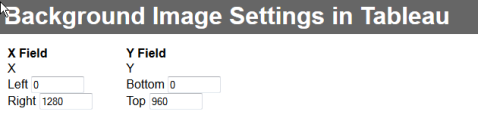
Tells us how to set up here:

background image settings

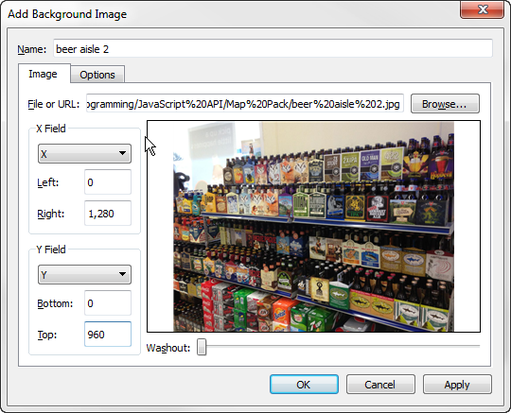
We’re going to use those settings one more time in a little bit. Now let’s press OK until we’re back on our worksheet. The Columns shelf in Tableau is the X-axis, and the Rows shelf is the Y-axis, so we want to bring our X and Y Measures out accordingly. Let’s also change the aggregation to AVG() instead of SUM.

Now you should see your image, but it may be cut off. We need to fix the axes to match with the same settings are the background image. Right click the x-axis, choose “Edit Axis”, then set Range to Fixed — Start = 0 , End = “Right” from our settings. In this case it is 1280. Now do the same for the Y-axis: Fixed — Start = 0, End = “Top” from settings (960 here). Now you should be seeing your whole image. Last, right click on both the x- and y-axes and de-select “Show Header”. Now you just see the image.initial setupBut we just have a single point in the middle! Where are our polygons we so lovingly drew? Tableau is rolling everything up into one single average point, because we haven’t split anything else out yet using the Marks card. Change the Marks card from “Automatic” to “Polygon”. Now I’m going to drag “Company Short Name” (my identifier) onto Color. It’s going to look ugly for a second, that’s okay. Drag “Path ID” onto “Path” and you should now see each polygon in a nice filled color.polygons
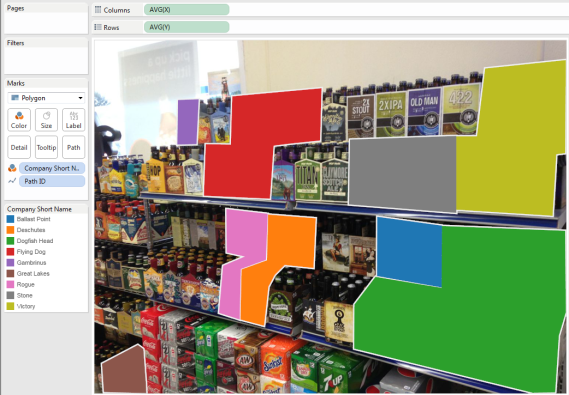
Now we can adjust our transparency and borders using the Color button on the Marks card. I find somewhere around 40% still distinguishes while letting the underlying show through. You may want the blocks colored solid, it’s all up to you.

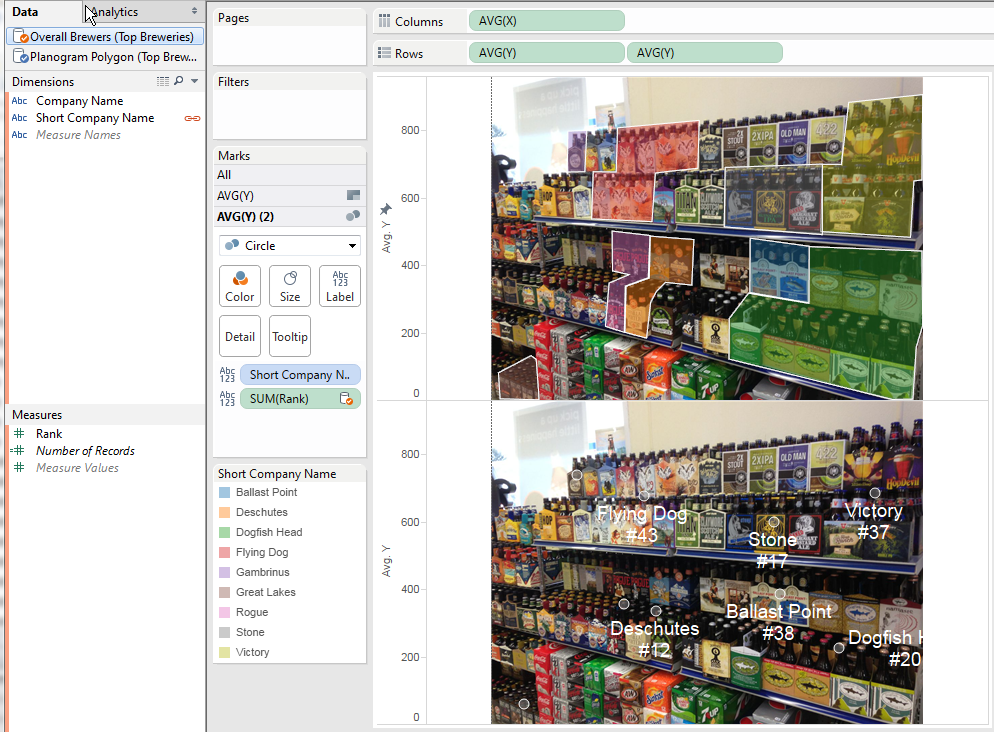
How do we get the labels like in the original image? We’ll use a Dual-Axis map to create a second layer. Press Ctrl and then drag your AVG(Y) to the right to duplicate it. You should see two maps, one on top of the other. There are also now three marks cards. Choose the one on the bottom. Drag “Path ID” away to the left to throw it away, and change the Mark type from Polygon to Circle. Now we have circles for each polygon, right in the middle (this is why we changed our aggregation to AVG() ).

Here we use Data Blending to bring in our data and layer it onto our polygons. Right-click on the Identifier field in the primary data source and rename it to match whatever identifies your data in the secondary data source. In my data, I change “Identifier” to “Short Company Name”. Now click into your Secondary data source. Drag a Measure out onto Label on the last Marks card, the one set to “Circle”. I also moved Short Company Name onto Label, and did some formatting so the labels are white instead of black.

blending in labels
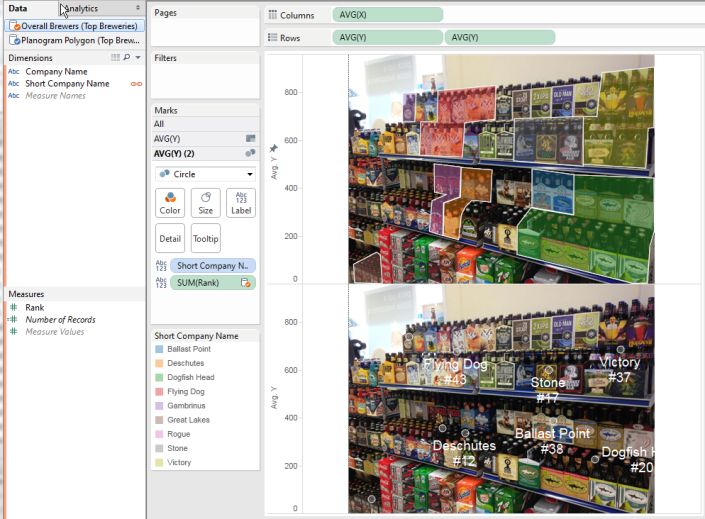
The last step is to right-click on the right AVG(Y) pill and choose “Dual Axis”. Right click the right y-axis and choose “Synchronize Axis”. You may need to de-select “Show Headers” for each of the two y-axes.

Now for an extra trick: If there are any labels not showing, right-click on the circle, choose “Mark Label”->”Always Show”. The label will now appear, and you can move it to a good place simply by dragging it. You can actually drag any of the labels around to place them better. You can turn the transparency on the circles to 0% and turn off borders to make the labels float on their own.

And there are the basics of building a planogram, or any other polygon set on top of a background map.